

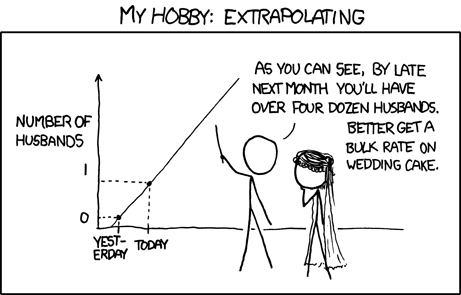
Original post is not linearly interpolating but exponentially.
this comic uses a log scale (I extrapolate this from the only two data points given).
(apologies for pedantry) This can’t be the case, as the zero point is visible in the graph and even gets crossed to the negatives. Log scale graphs only show positive values and place zero infinitely below the horizontal axis.
If that were the case, the y-axis label would be
log(NUMBER OF HUSBANDS), no?It’s a choice, it’s not mandatory to use a log on your y axis when you plot a log.
Bless the Maker and His water. Bless the coming and going of Him. May His passage cleanse the world. May He keep the world for His people.
Dude what? Where did this come from?
It’s a Dune quote for when the fremen see sandworms. The guy is saying his kid will weigh several tons, so logically he will evolve into a sandworm.
Neatly showing why when all you have is two data points you can’t just assume the best fit function for extrapolation is a linear one.
Mind you, a surprisingly large number of political comments is anchored in exactly that logic.
